
The Police Scorecard Project
We were asked to design the first police scorecard in the United States. It was created to identify urgent issues surrounding police accountability and propose best-practice solutions based on an impressive collection of data.
DATA IS ESSENTIAL
On platforms where users tend to spend just a few seconds on each piece content, conveying complicated information in a clear way is crucial. For social justice movements, sharing supporting research can inspire policy changes and prompt action. That’s where data visualization comes in. According to research complied by 3M, we can process visuals 60,000 times faster than text. They go on to say the average person only remembers about 1/5 of what they hear. Combining visuals with statistics reinforces the information, increasing retention.
ACTIVISM, DESIGN, AND DATA VISUALIZATION ARE JUST OUR CUP OF TEA
Armed with this information, we set to work on a clean, interactive design for the scorecard that was optimized for both mobile and desktop.
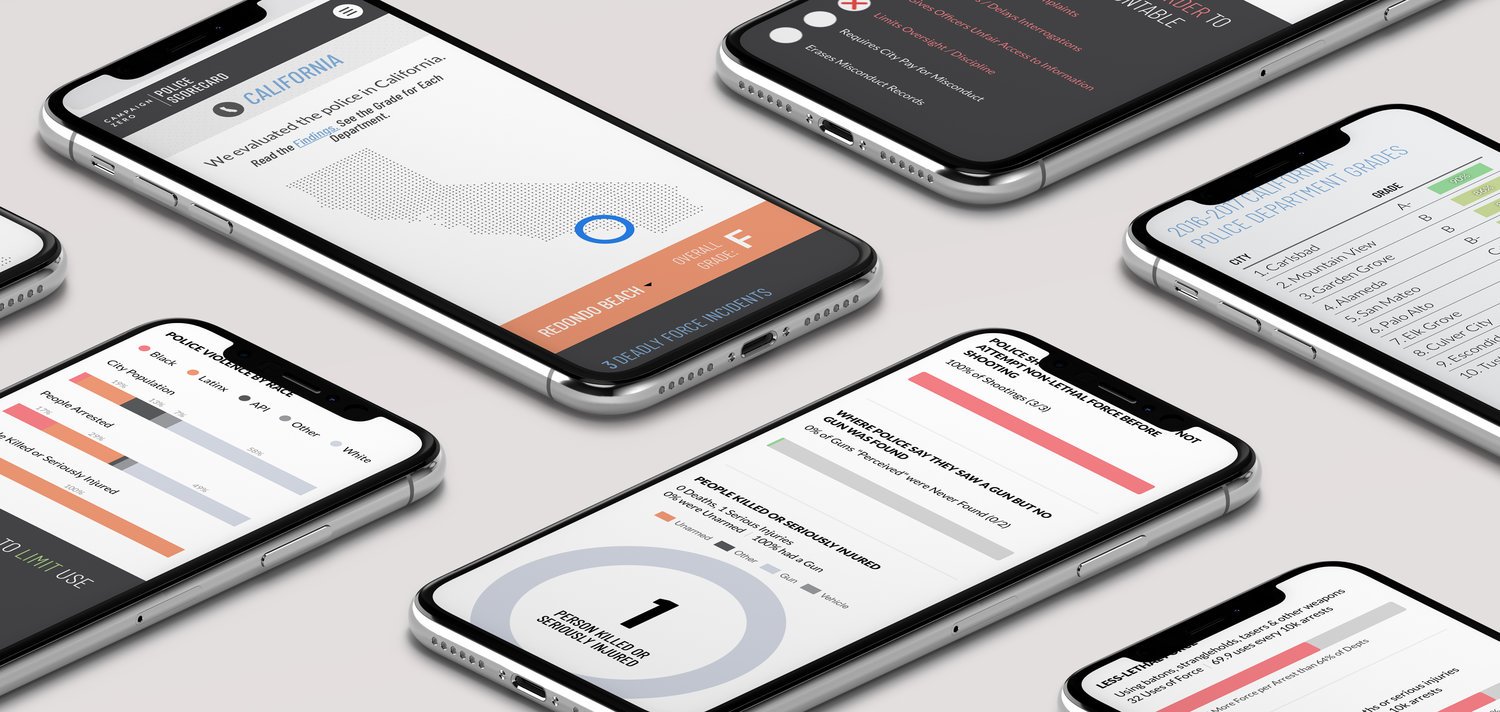
Images of the website on smartphones.

“Just wanted to say thank you so much for designing the Police Scorecard and making this project look so incredible! So many people have reached out saying they love the design.”
-Samuel Sinyangwe
Founder, Police Scorecard & Mapping Police Violence

As a result, several police chiefs ordered a review of their policing practices, and officials began adding the site’s recommended policies to their policing agendas.
Press
-

‘Police Scorecard’ raises questions about use of force and accountability in California
LA Times
-

A Scorecard for Police Departments
The Atlantic
-

National database on police killings tracked 1,127 deaths last year
The Hill